Hyping Hyperspectral
Contents
Hyping Hyperspectral
Short summary. A guest post by Casey Backes on hyperspectral imaging: what these sensors are, the main instrument designs (dispersive, Fourier transform and filtered), and why the technology is poised to take off.
Guest article by Casey Backes (Xplore). Originally published 19 May 2022.
Note
This article is brought to you by Casey Backes, Remote Sensing Data Scientist at Xplore.
Soon this site will transition to a curve.space deployment. See a preview of this article here.
Introduction
The spectral bandwidth of human vision is shamefully limited. A vastly rich information set exists outside of perceptible human vision in colors we can’t directly see. While bees can use ultraviolet light to locate valuable nectar on flowers, and snakes can sense infrared light for an advantage over prey in the darkest of nights, humans have invented ways to harness “invisible” colors as well. The innovation of modern sensors used in remote sensing specialize in certain color regions of light – the most sophisticated of which can detect hundreds of colors of light at one time.
These are hyperspectral sensors and we are only beginning to unlock the next step change of innovation these sensor can enable. NASA’s Earth Observing 1 (EO-1) satellite flew such a sensor – the Advanced Land Imager – to low earth orbit from 2000 to 2017, returning images in far more colors than the common Red-Blue-Green regime. It was able to see up to 220 colors between blue (0.4um) and short-wave infrared (2.5um) EO-1 Sensors. This hyperspectral sensor alone was responsible for providing supporting data for more than 600 published articles between 1999 and 2016 according to Transon et al. (2018). And what did we learn? That a vastly rich characterization of the earth can be constructed and regularly updated to a high degree of precision and accuracy with such space-based hyperspectral sensors.
Defining the System
Hyperspectral imagers, sometimes known as imaging spectrometers, come in all shapes and sizes. The top-level science requirements drive instrument specifications like bandpass, signal-to-noise ratio, spectral resolution, and spatial resolution. Depending on the priority of these typically competing objectives, instrument design proceeds until the needs are met. This can take years, with aircraft flight demonstrations being a typical step in the process. Broadly speaking, modern hyperspectral imagers fall into the following categories:
Dispersion imaging spectrometers use prisms or diffraction gratings to spread light somewhere in the system, then focus it in a way that a continuous spectrum is generated for a single “pixel” on the ground
Fourier transform spectrometers can seem exotic at first glance, but many have been flown in space especially in the infrared; they use a scanning detector and interference patterns to generate spectra
Filtered hyperspectral imagers may be the easiest of the bunch to understand, where many segmented filters or a “linear variable filter” is placed on the focal plane array for spectral selectivity

Fig. 3 Isaac Newton pioneering the first dispersive component - a prism.
An interesting starting point on the path to understanding these various architectures is “Comparison of relative signal-to-noise ratios of different classes of imaging spectrometer” Sellar and Boreman 2005. This article differentiates spectrometer classes by their spatial, spectral, and temporal acquisition methods. Essentially, a main collection aperture gathers a certain number of photons. From there the optical designer must chose how to pick out or modulate the incoming light such that different spectral features can be resolved at the needed resolution.
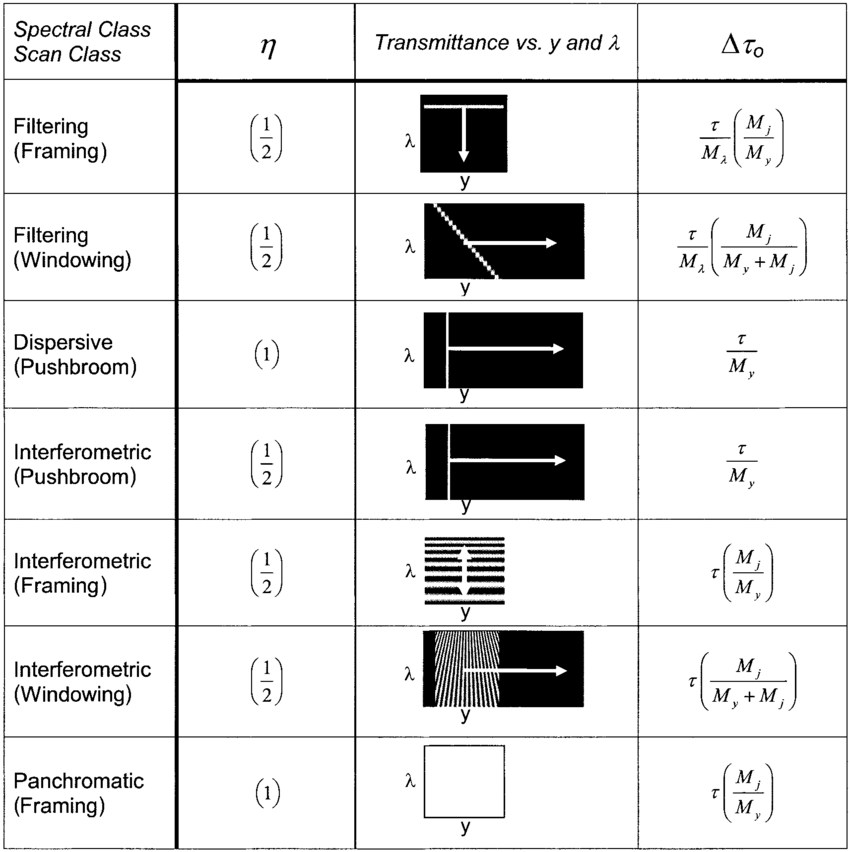
Fig. 4 Classification of imaging spectrometers from Sellar & Boreman reference. Keep an eye out for a Python tutorial covering this paper’s methodology!
Traditionally, the longer the wavelength (short-wave IR, long-wave IR, and thermal IR) the harder it is to achieve a good spatial resolution of ground imagery. (All things scale with wavelength, so systems must at least be large and often cooled.) But as more commercial Earth observation (EO) companies come online, the boundaries are gradually being pressed back to reach higher ground resolution with these longer wavelengths. With these advancements we will finally have an apples-to-apples comparison (same spatial resolution for different wavelengths) of any place on earth.
Applications
Digital agronomy (agriculture studies) leverages the relatively higher infrared reflectance of healthy plants compared less healthy plants to determine crop stress due to water and insects – known as the Net Difference Vegetation Index, or NDVI – and use this information for farming maintenance and crop yield estimates. Insurance service providers leverage hyperspectral data to quantify the risk to agricultural and urban assets in areas at risk of water and fire damage. As more commercially focused companies come online, the boundaries are being pressed in technological areas that have traditionally remained out of grasp.
I was never a fan of chemistry in college, but the Astrophysics and Planetary Science major requires at least a superficial understanding of atomic physics as related to the emission and reflection of light from differing materials. It was in this context that chemistry finally became somewhat interesting. Since most materials are made of more than one atomic constituent, the emission and reflection of light can vary by color – or wavelength. It is this variation in intensity of reflected and emitted light that a spectral curve represents and will vary significantly from one material to the next.
This is most interesting when we look at the spectral curves of several samples of the same class. Vegetation for example can show a higher intensity in the infrared compared to unhealthy samples of the same type of vegetation. This is incredibly useful for farming companies – they can use remote sensing hyperspectral data products to get a quick health assessment of 100s of square kilometers of farmland. As the environment, social, and governance (ESG) movement has grown in recent years, many organizations are being required to keep greenhouse gas emissions to a minimum. Hyperspectral remote sensing helps identify and differentiate atmospheric gaseous species in the air near known emitters – like differentiating the spectral presence of methane or CO2 in the air near an oil/gas processing facility.

Fig. 5 ESG & EO, quite the dynamic duo!
As a visual learner and early-career entrant to the EO and hyperspectral community, one of the most exciting hyperspectral data products I’ve encountered is band-composite imagery, which vibrantly brings to life the complex science of this field. I’ll save the deeper dive for an upcoming article, but you should absolutely take a look at some of the amazing examples in the last half of the Landsat 8 Band and Band Combinations webpage as well as the (less scientific but jaw-droppingly gorgeous) Landsat Earth as Art collections.
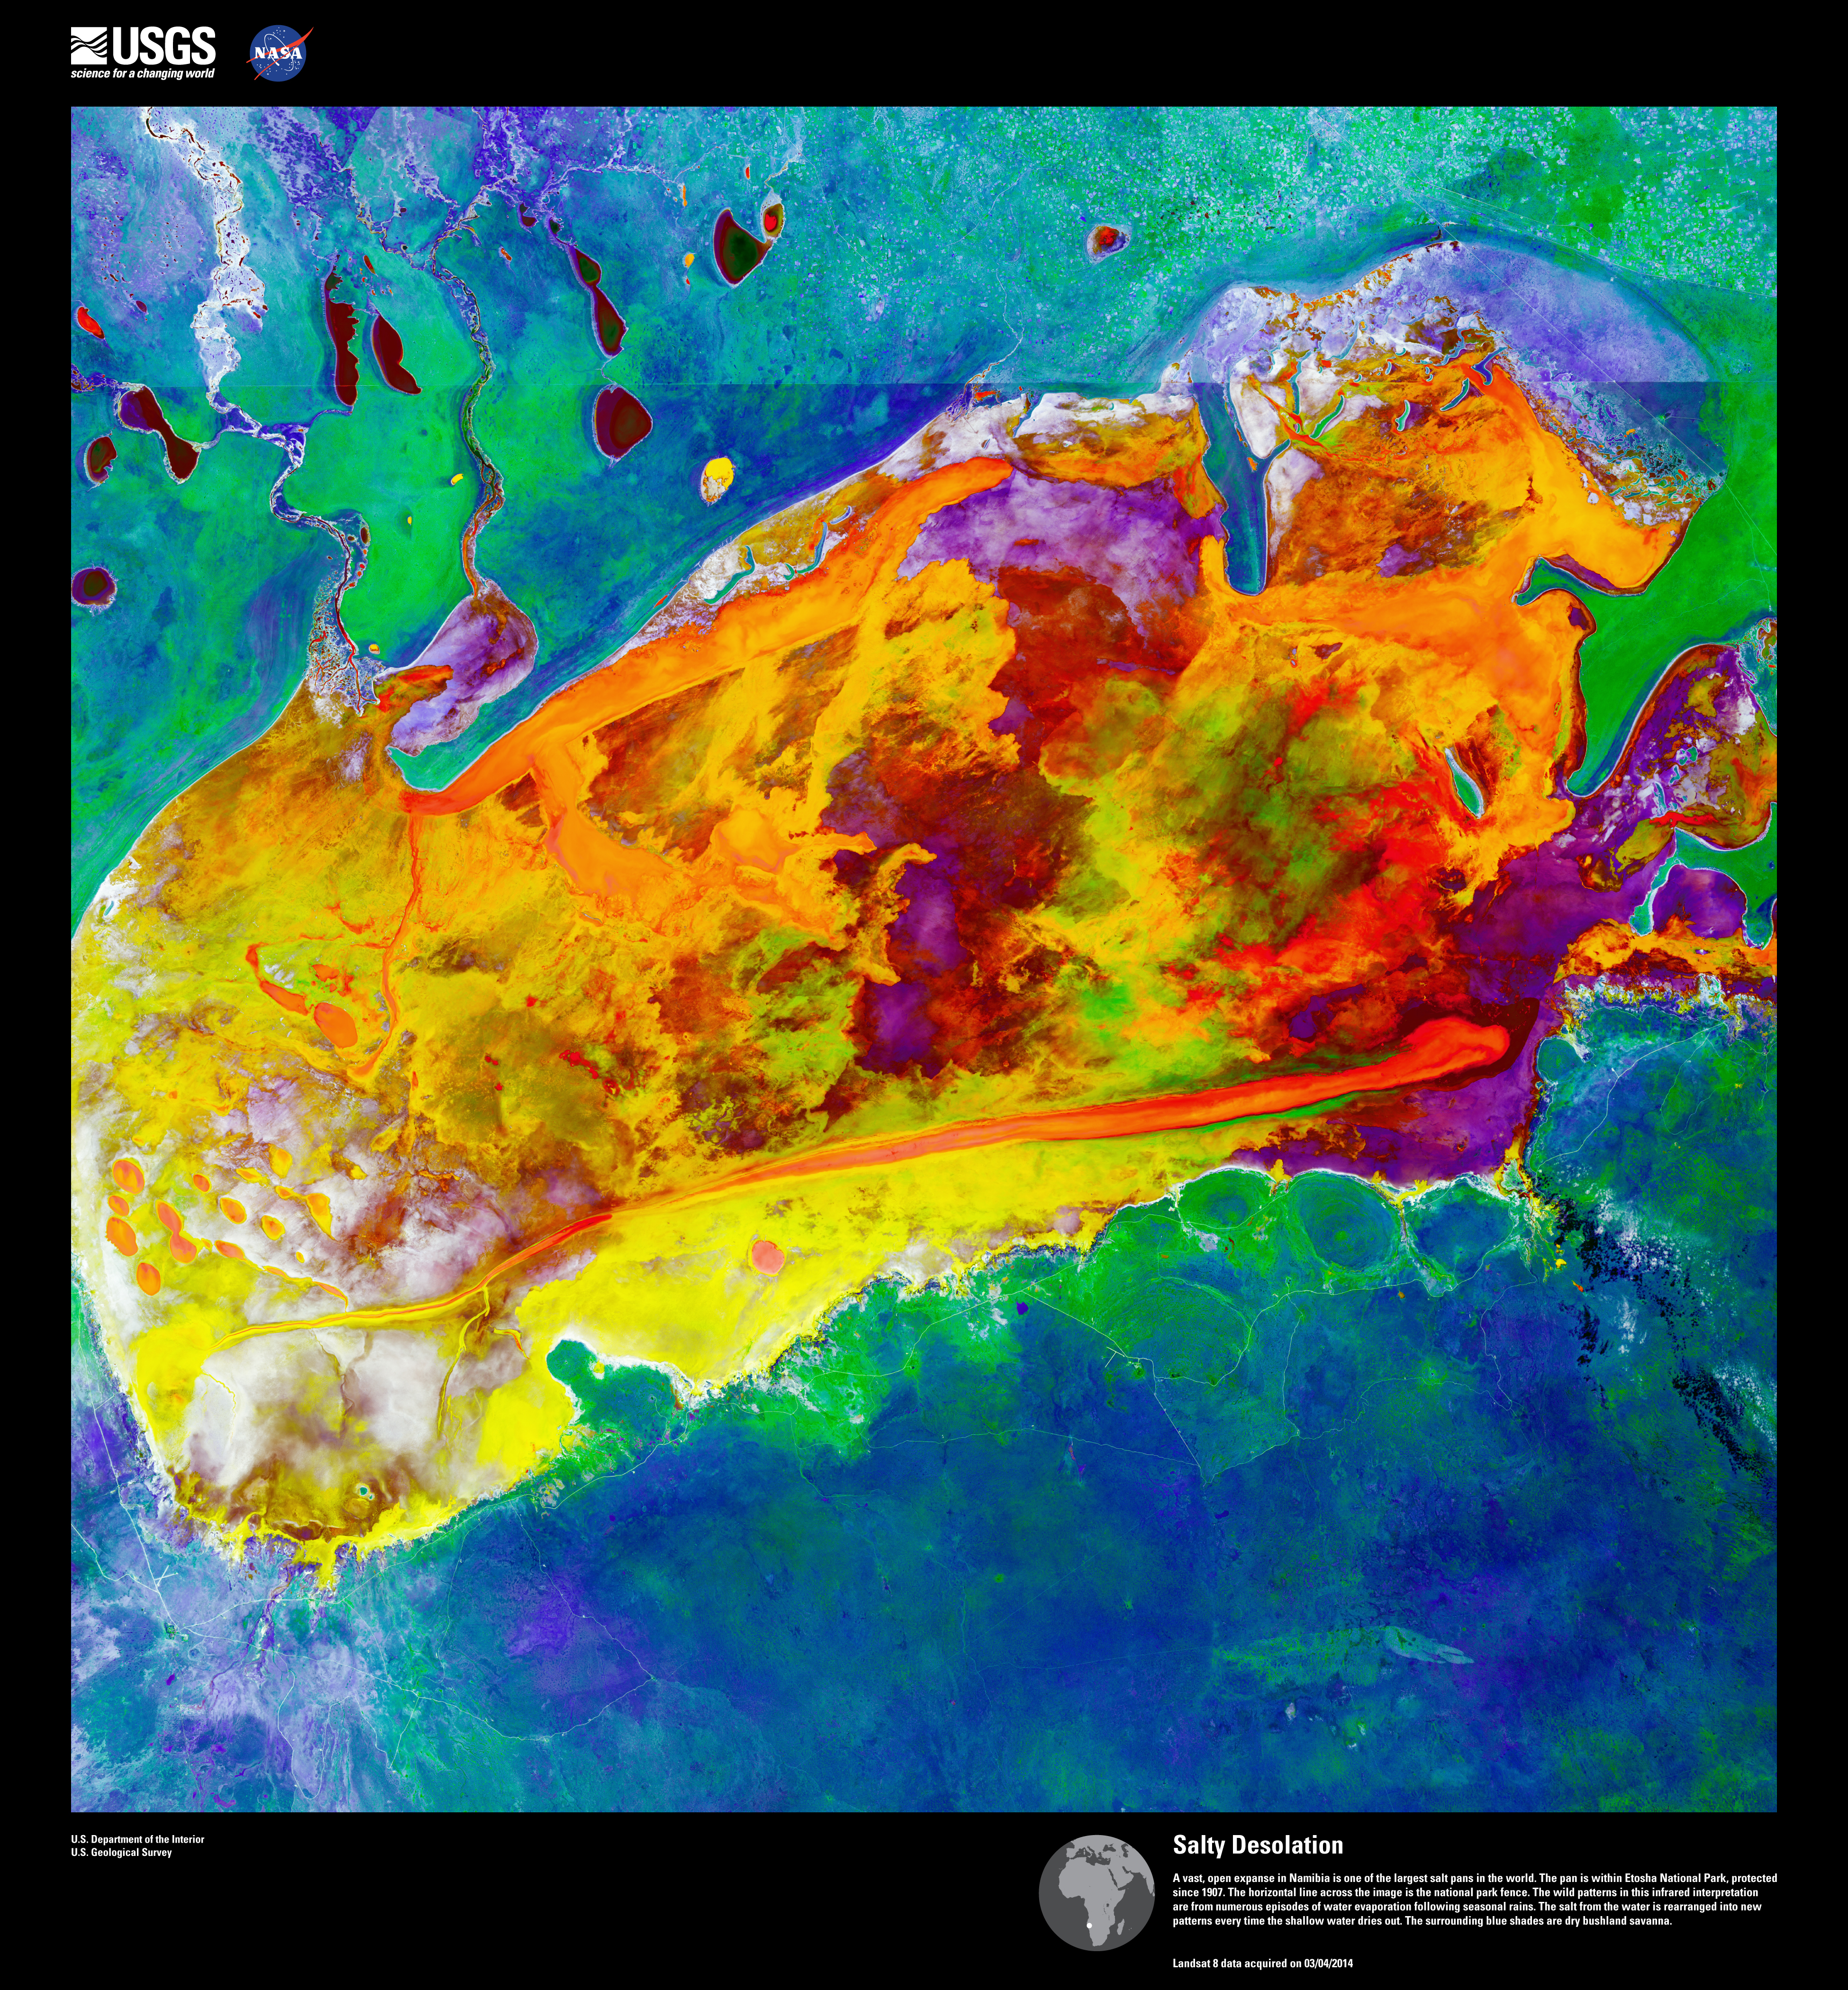
Fig. 6 Image courtesy USGS/NASA.
Future Trends
There are a multitude of government-sponsored and commercial hyperspectral space missions coming online in the next few years, specifically for EO applications. “Survey of Hyperspectral Earth Observation Applications from Space in the Sentinel-2 Context” Transon et al. (2018) gives an excellent summary of global missions being launched by various space agencies. The bands of interest across a number of different applications are also given. On the commercial side, companies like Orbital Sidekick and Pixxel are promising hundreds of bands at spatial resolutions of 8 and 5 meters, respectively.
New materials and subsystems are enabling cheaper, more performant systems year by year. A particularly interesting infrared mission to watch is HyTI Wright 2019, from the Hawaii Spaceflight Laboratory. This Fourier transform interferometer captures images on a cryocooled sensor developed by JPL. This is an especially capable system for a CubeSat platform, and is expected to be thermally constrained due to cryocooler operations. Images will be processed onboard, another unique feature enabled by a Unibap onboard compute solution. Onboard data processing - which would allow for only bands of interest to be selected for downlink, or even algorithms to be run on board - will no doubt be part of the next wave of hyperspectral data delivery. Increasing downlink capacity is another avenue of improvement. (Bring on the space lasers!)
Conclusion
The hyperspectral imaging field seems to finally be getting deserved attention from commercial and government end-users. Kevin and I got our start tinkering in the lab with a 3U hyperspectral imager called CHAP. It didn’t fly, but we delivered to a NASA research center and learned some things along the way. It’s exciting to see more capable CubeSats and ESPA-class SmallSats in larger numbers every year, with the supporting systems for increasingly capable instruments.
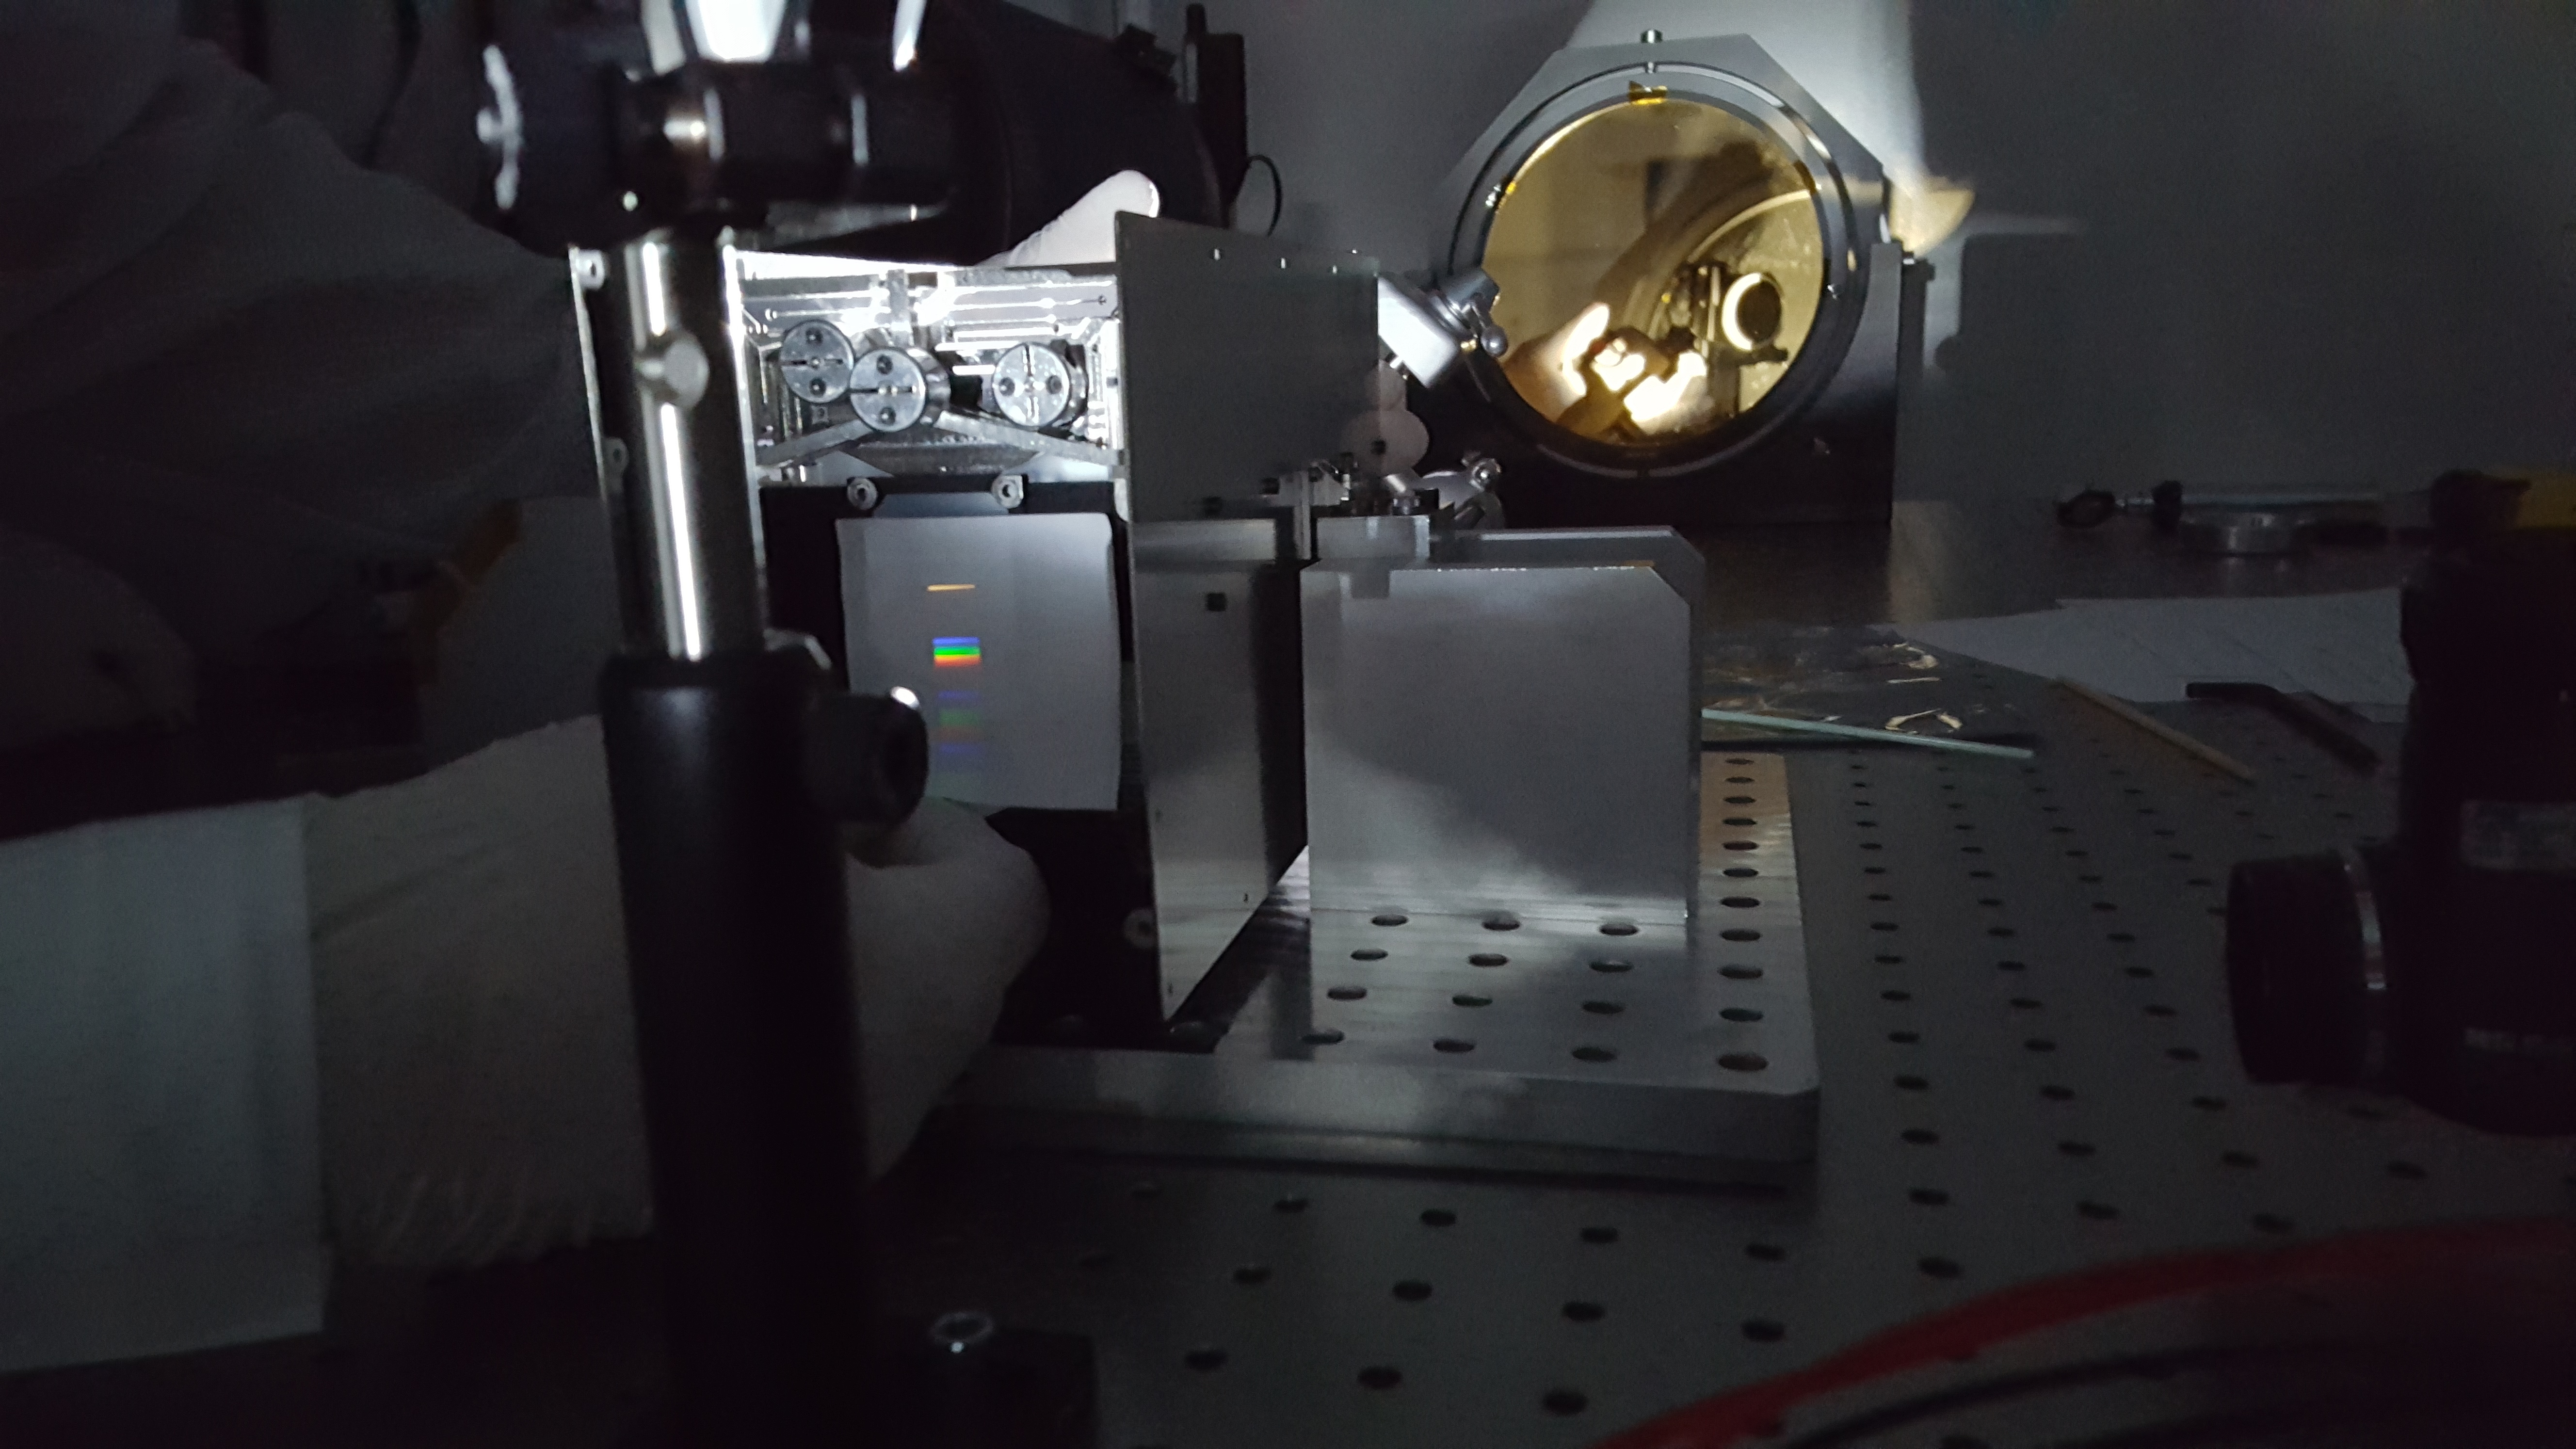
Fig. 7 If you squint, there are three diffraction orders visible from this lab image of the CHAP hyperspectral imager.
We’ll be following up with more articles soon, so let us know what would be interesting to see! If you enjoyed reading, please subscribe and share.